CRM Dashboard
 Pipeline Performance
Sales lead value by stage, conversion rates, owner breakdown and next-contact focus — all from the live pipeline, not a daily export.
 Invoicing and Sales
Won leads turning into invoices, invoiced turning into paid — the financial side of CRM tied back to the sales activity that created it.
 Campaign Summaries
Headline metrics from every recent campaign — opens, clicks, unsubscribes — so you see which messaging is working without opening each campaign in turn.
 Role-Aware View
The dashboard is assigned to a user. A salesperson sees their own numbers; an owner or manager sees the whole business — same dashboard, context-aware.
Dashboard
The whole sales and customer picture, at a glance.
One screen brings together four views of the business: the sales pipeline, the invoicing that flows from it, the campaigns that feed it, and the per-user split between new business and existing customers. Because the CRM, accounting, campaigns and contacts all live in the same self-hosted database, the dashboard queries them together — no integration layer, no daily export, no overnight delay.
The dashboard is assigned to the user, and their role decides what they see. A salesperson opens it and sees their own pipeline, their own campaign contributions, their own new-business vs existing-customer split. An owner or manager opens the same dashboard and sees the team's numbers aggregated. One dashboard, context-aware to who is looking.
Filter the whole thing by date range. Click through any panel to drill into the underlying records. Nothing leaves your installation — no third-party analytics service, no cloud BI provider, no exported extract sitting somewhere else.
Download free edition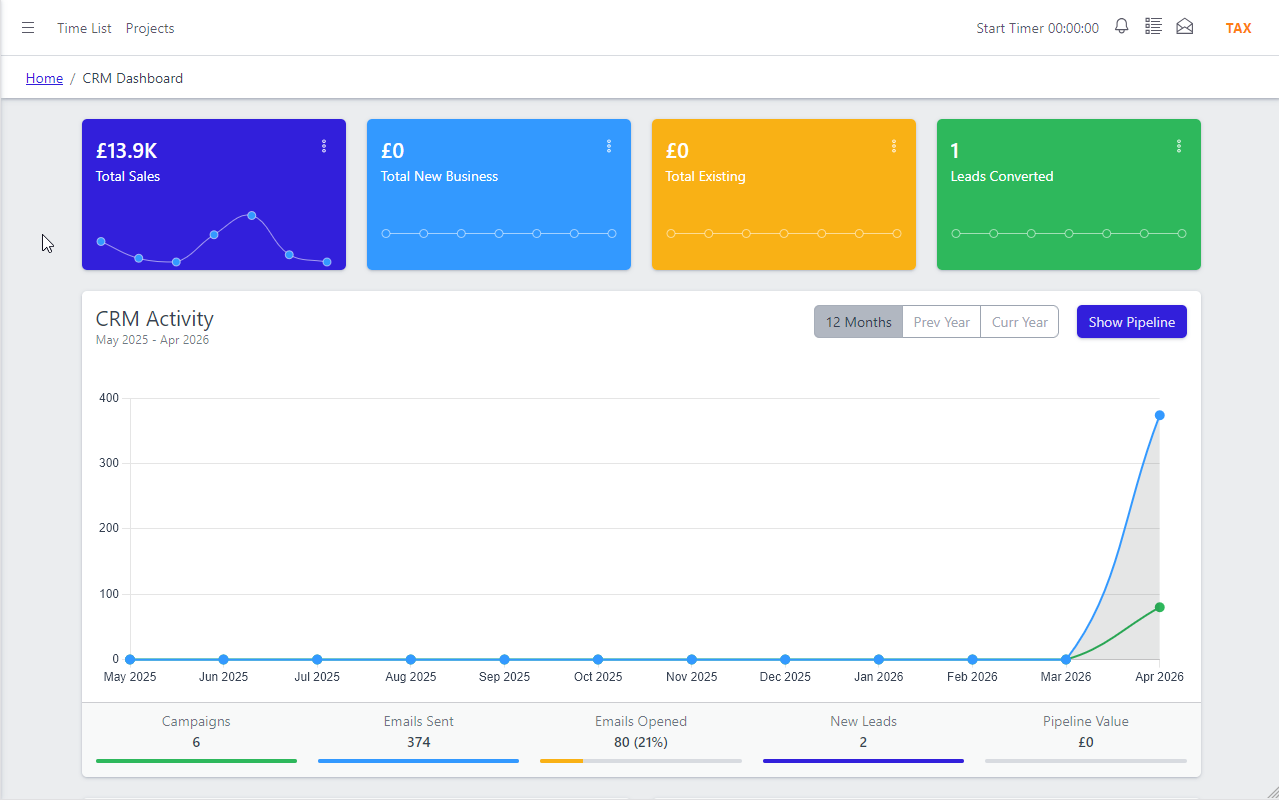
Key CRM metrics, on one screen.
The top of the dashboard shows the pipeline as a funnel by stage — open opportunities, qualified sales leads, proposals out, commitments made — with a value total against each. Below that, invoicing tied back to won leads: outstanding invoices by age, paid this month, and forecasted billing from commitments not yet invoiced.
On the campaign side, the last few campaigns appear with their headline metrics — delivery rate, open rate, click-through, unsubscribes — so trends across your messaging are visible without opening each campaign. The per-user panel splits each salesperson's activity into new business and existing customers, so a manager can see the team's effort-mix at a glance.
Everything is live. Filter by date range (this week, this month, this quarter, custom). Click any figure to open the underlying records in a list — an opportunity count in the funnel drills to the actual opportunities; an outstanding invoice total drills to the invoice list. The dashboard is not a static summary; it is a front door into the live data.
- Pipeline funnel with value by stage.
- Outstanding and paid invoices tied to won leads.
- Campaign headline metrics summarised.
- New business vs existing customer per user.
- Filter the whole dashboard by date range.
- Click through to any underlying record.
Frequently asked questions
Short answers on how the CRM dashboard behaves across roles and data sources.
Four views of the business: sales pipeline performance by stage and by owner, invoicing and sales tied back to won leads, headline metrics from recent campaigns, and a per-user split between new business and existing customers. All pulled live from the underlying records — nothing is a daily export or a cached snapshot.
Yes. Filter the whole dashboard by date range — this week, this month, this quarter or a custom range — and drill into any panel to see the underlying records. A sales manager can look at their own numbers or the team's; an owner can look at yesterday, this month or the full year.
The dashboard is role-aware. It is assigned to the user, and their role decides what they see. A salesperson opens it and sees their own pipeline, their own campaign contributions, their own new-business vs existing-customer split. A manager or owner sees the same dashboard aggregated across the team. One dashboard, context-aware to who is looking.
It is the opposite of a separate BI tool. Most dashboards sit outside the operational system and rely on daily or hourly data exports — you see last night's snapshot, not this afternoon's position. YouDoCRM's dashboard queries the same database that runs the CRM, accounting, projects and time tracking. What you see is live, and there is no integration layer to maintain.
No. The dashboard runs inside your self-hosted installation. Nothing is sent to an external analytics service, a cloud BI provider or any third party. Your pipeline numbers, sales figures and campaign performance stay on your own server.
Yes. The dashboard layout adapts to small screens so you can check pipeline health, invoicing position or campaign metrics from a phone. All the drill-through behaviour works the same way on mobile as on the desktop.